Calculation Summary

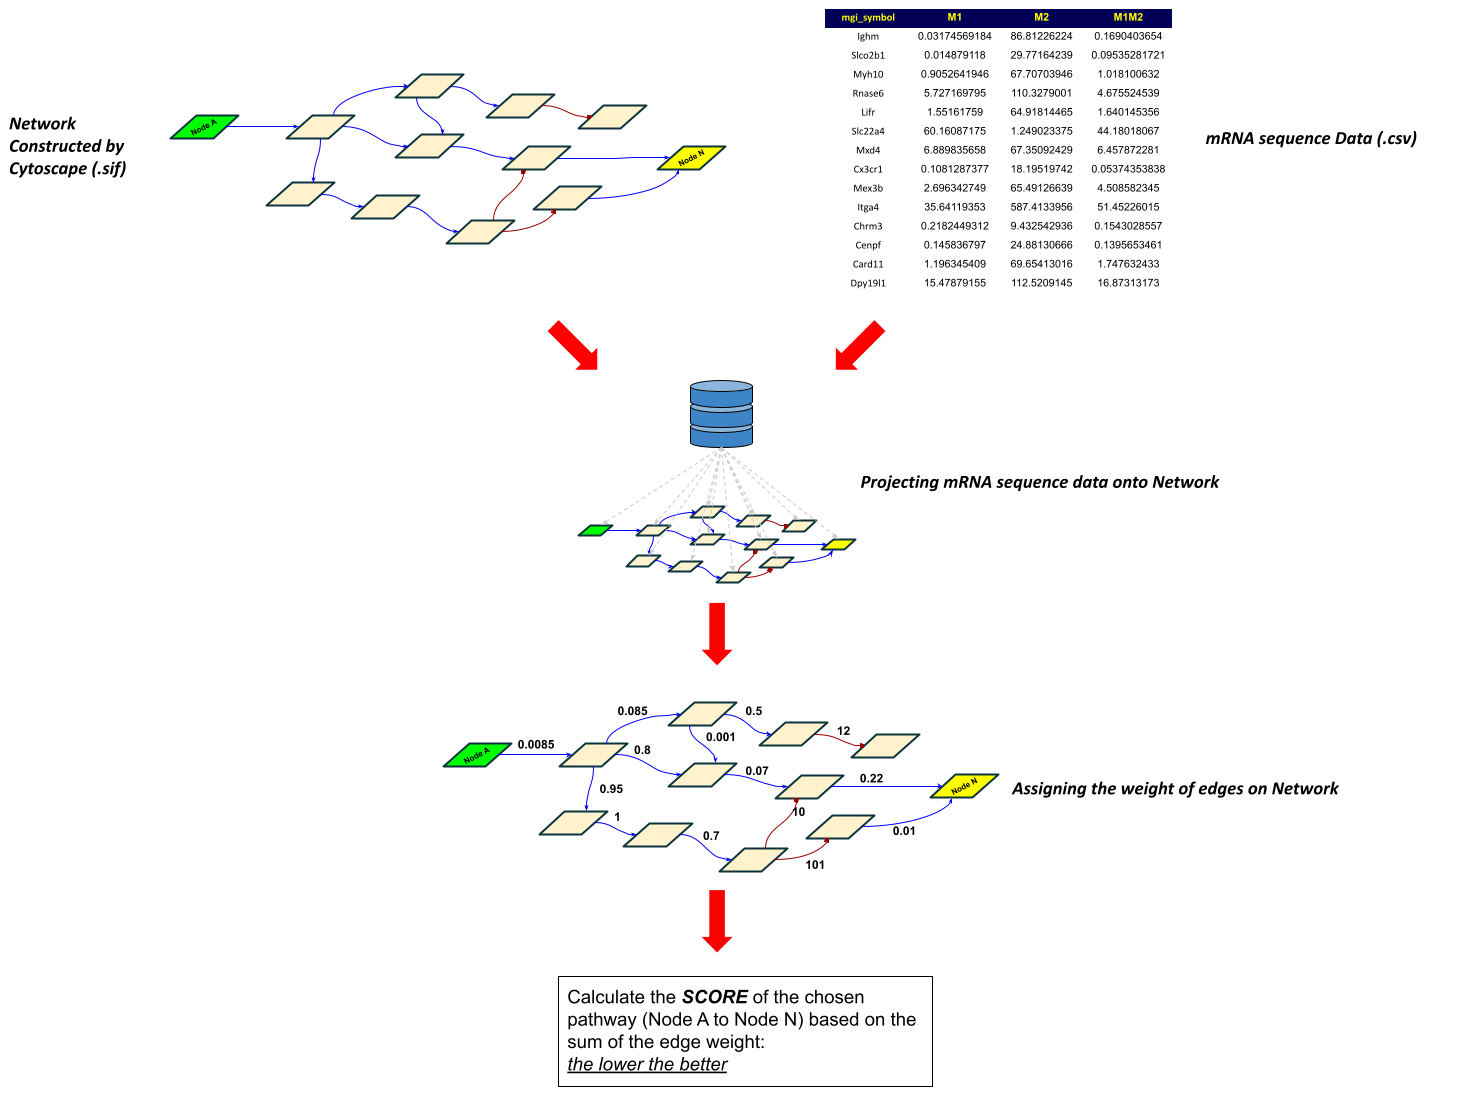
NetworkX-based network analysis based on the weight of edges/path evaluated by mRNA sequence data (and possibly protein expression data set)
Full script is available HERE under Analysis section
Step 1
As introduced via Cytoscape, the user can construct the desired network and generate sif file by exporting the completed network.
Step 2: exporting mRNA sequence data based on the network node name
The python script exports the list of node names from the sif file, then construct another data tree of the mRNA sequence expression date from M1, M2, and M1M2 (M2 phenotype treated with M1 MEV).
The following is the example for the data structure the script generates from network file (sif) and mRNA sequence file (csv)
M1_data_set = {'NodeName_1': Expression_Value_from_mRNA_1,
               'NodeName_2': Expression_Value_from_mRNA_2,
               'NodeName_3': Expression_Value_from_mRNA_3,
               'NodeName_4': Expression_Value_from_mRNA_4,
               'NodeName_5': Expression_Value_from_mRNA_5,
               ...
               'NodeName_N': Expression_Value_from_mRNA_N}
Step 3: ranking the node by 4 integers based on the expression level
Since the expression data provided by mRNA sequence analysis are not absolute scale, the script takes an arbitrary/abstract classification to evaluate the degree of expression by simple statistical tool, such as percentile. For instance, the node or protein with expression falling into below 10% percentile is ranked as 1. The rest of ranking scheme is as the following:
if Exp_mRNA_Node <= percentile_10:
    rank = 1
elif percentile_10 < Exp_mRNA_Node <= percentile_50:
    rank = 2
elif percentile_50 < Exp_mRNA_Node <= percentile_95:
    rank = 3
elif Exp_mRNA_Node > percentile_95:
    rank = 4
This process is applied to all the cases such as data from M1, M2, and M1M2.
In the later, if node name does not appear in the mRNA sequence data, then 0 is assigned for its rank.
Step 4: assigning binary for fold change
In specific example of M1 repolarization, we are targeting M2 vs. M1M2. Specifically, the network is M1 polarization oriented. Thus, it is ideal to obtain up-regulated expression from M2 to M1M2.
FC = Exp_mRNA_Node_M1M2/Exp_mRNA_Node_M2
if log2(FC) > 0:
    "Up-Regulated" so it is 1
elif log2(FC) < 0:
    "Down-Regulated" so it is -1
There are four cases we are analysing in this specific calculation
- M2 to M1M2
- M1M2 to M2
- M2 to M1
- M1 to M2
1 and 2 are complementary processes so case 1 is calculated as log2(M1M2/M2) and case 2 is negated case 1.
Step 5: weighing edges
This is a critical part of analysis.

In our scoring scheme, spontaneous path is expressed with low edge weight
Step 6: calculating the total cost of pathway mediated by a given receptor
There are four scores the script generate
M1_targetM2_targetM1_controlM2_control
targetmeans it is based on M2 and M1M2 dataset.
For instance, the score of M1_target, in which M2 is being repolarized to M1M2, is a function of two variables, M2 expression and log2(FC[M2 to M1M2]). The details of calculation is shown in the weighing edge calculation or click HERE.
controlmeans it is based on M1 and M2 dataset.
For instance, the score of M1_control, in which M2 is being repolarized to M1, is a function of two variables, M2 expression and log2(FC[M2 to M1]). Basically, replace Total FC_M2toM1M2 with Total FC_M2toM1 in the weighing edge calculation.
Step 7: final evaluation
All pathways (due to the limitation of our model) can go either M1 or M2 polarization as the final destination but their Scores obtained by this script reflect their roles in inflammation. To maximize the difference between pro- and anti-inflammatory receptors, we divide complementary scores.
For instance, instead of reporting or ranking the pathways based on M1_target itself, we divide M1_target by M2_target.
In this specific example, we provide all the possible combinations, but M1_target/M2_control should demonstrate the most robust score since the M2_control conveys the most natural degree of receptor’s association with M2 polarization.