What’s in this script?

Getting started
- Colab version script:
- Make sure you copy this file into your own Google Drive
- Click “File” in the main tap
- Click “Save a copy in Drive”
Loading Packages
- Execute the following script in ipynb or Colab script by either click the play button or press [Shift] + [Enter]
import os
os.system('git clone https://bending456@bitbucket.org/pkhlab/pathwayanalysis.git')
os.chdir('/content/pathwayanalysis') ## <------ This is your working directory so click the folder symbol to navigate it

os.system('apt-get install graphviz libgraphviz-dev pkg-config')
!pip3 install networkx
!pip3 install pygraphviz
!pip3 install graphviz

import networkx as nx
import numpy as np
import matplotlib.pyplot as plt
from networkx.drawing.nx_agraph import graphviz_layout
from graphviz import Digraph
import utilities_new as util
import pathwaySearch_new as ps
import pandas as pd
import math

%load_ext autoreload
%autoreload 2
Analysis
User Guide
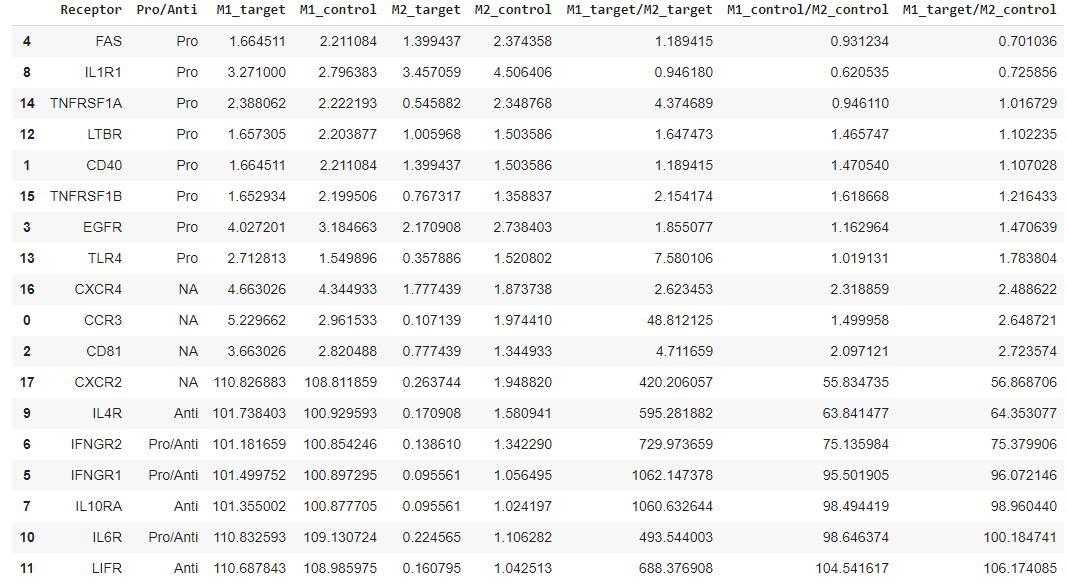
- The first outcome as you execute the following cell is the list of receptor names in the network library and corresponding score that the script processed
M1target, M1control, M1target_df, M1contro_df, path_M1, ligand_expM1  = ps.runItAll(
                                                mRNA_inputfilename = 'mRNAseq_all',
                                                Prot_inputfilename = 'Ab_Chris',
                                                network_inputfilename = 'network',
                                                receptor_list = 'receptorlist',
                                                ligand_list_file_name = 'ligandlist',
                                                destination = 'M1_polarization',
                                                unit_test_receptor = 'IL1R1',
                                                listofNodes_path = False)

M2target, M2control, M2target_df, M2contro_df, path_M2, ligand_expM2  = ps.runItAll(
                                                mRNA_inputfilename = 'mRNAseq_all',
                                                Prot_inputfilename = 'Ab_Chris',
                                                network_inputfilename = 'network',
                                                receptor_list = 'receptorlist',
                                                ligand_list_file_name = 'ligandlist',
                                                destination = 'M2_polarization',
                                                unit_test_receptor = 'IL1R1',
                                                listofNodes_path = False)

M1M2Scoretarget = []
M1M2Scorecontrol = []
M1M2Scoreref = []
for i in np.arange(len(M1target['Score'])):
  newtarget = float(M1target['Score'][i])/float(M2target['Score'][i])
  newcontrol = float(M1control['Score'][i])/float(M2control['Score'][i])
  newref = float(M1target['Score'][i])/float(M2control['Score'][i])
  M1M2Scoretarget.append(newtarget)
  M1M2Scorecontrol.append(newcontrol)
  M1M2Scoreref.append(newref)

M1M2totalScore = {'Receptor': M1target['Receptors'],
                  'Pro/Anti': M1target['Pro/Anti'],
                  'M1_target': M1target['Score'],
                  'M1_control': M1control['Score'],
                  'M2_target': M2target['Score'],
                  'M2_control': M2control['Score'],
                  'M1_target/M2_target': M1M2Scoretarget,
                  'M1_control/M2_control': M1M2Scorecontrol,
                  'M1_target/M2_control': M1M2Scoreref}

df = pd.DataFrame(M1M2totalScore)
df.sort_values('M1_target/M2_control',ascending=True)
Analysis
User Guide
Unless there is further notice, there is no required additional action to execute this script.
List of inputs for runItAll:
mRNA_inputfilename:-
mRNA input file name.
-
In current model, there are two types of mRNA sequence data stored in database:
-
a) entire mRNA sequence dataset (
mRNAseq_all) and -
b) selected mRNA sequence data whose p-value < 0.05 (
mRNAseq_p5)
-
Pro_inputfilename:-
Ab_Chrisis available. -
In the current calculation, though, this dataset has not been included, yet.
-
network_inputfilename:-
The sif file generated by Cytoscape is required to run this script.
-
Currently, there are more than one sif file.
-
The basic one is
network, -
extended version is
networkExtended, and -
microglial pahtway is stored as
networkMicroglia.
-
receptor_list:-
There is a single text file containing the list of receptors in all version of networks along with its role in inflammation.
-
This file is intended to be utilized in any version of network.
-
The code will automatically ignore if the receptor in the receptorlist file is not recognized in the network file.
-
ligand_list_file_name:-
the yaml file containing the list of ligand for the series of receptors
-
This has not been utilized in the calculation, yet.
-
destination:-
network analysis starts with the starting node, in this case receptor, and the end node that is “destination”.
-
In this specific analysis, we will use two destinations
-
M1_polarization -
M2_polarization
-
unit_test_receptor:- currently, this function is off
listofNodes_path:-
Boolean (
TrueorFalse) -
It allows you to print out each node within a given receptor-mediated pathway. Try it!
-
Analysis Outcome
Outcome 1

Column 1: Receptor
Name of receptor
Column 2: Pro/Anti
Pro/Anti-inflammatory receptor indicator
Column 3: M1_target
“Target” means the repolarization related data. For instance, the regular polarization between M1 and M2 should be simply based on the expression data from M1 and M2 mRNA sequence analysis. However, the repolarization is done by the comparsion between M2 mRNA sequence data vs. M2 treated with M1 MEV. In this case, we name the M1 repolarization score as
M1_target.
Column 4: M2_target
This is a score based on the hypothetical experiment where the macrophages are repolarized from M2 treated with M1 MEV back to M2 state.
Column 5: M1_control
Controlindicates the possible polarization between M1 and M2 without any further treatment with MEV. In this case, the data from M1 and M2 are directly utilized to evaluate the M1 polarization from M2. Therefore, the fold chance is obtained by calculating log2(M1expression/M2expression).
Column 6: M2_control
Vice versa
Column 7: M1_target/M2_target
This is where we penalize pathways strongly associated with M2 polarization. For instance, the scores from
M1_targetfor pathway A and pathway B are indistinguishable. Thus, we are looking into each receptor-mediated pathway leading M2 to evaluate which pathway is more close to M2 polarization (M2_target.) Then,M1_targetis divided byM2_targetto reflect how strongly a given receptor is associated with M1 polarization.
Column 8: M1_control/M2_control
In this case, the conventional M1 polarization is re-evaluated based on the degree of M2 polarization induction.
Column 9: M1_target/M2_control
M2_targetmay not accurately refelct a given pathway and its anti-inflammatory characteristics because of possible incompletion of repolarization. Therefore, we useM2_controlfor robust evaluation.
Checking out the raw data
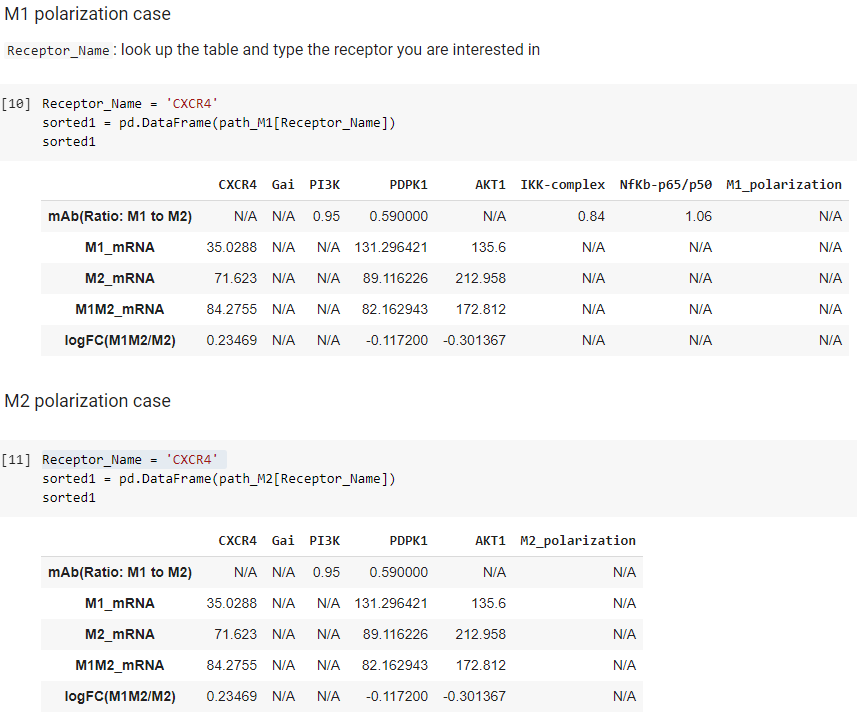
- The following cell will print out the table based on a name of receptor you desire (Receptor Names listed in the table above).
Column 1: Name of data
- mAb: protein expression data (From M1 to M2)
- M1_mRNA: mRNA expression data in M1
- M2_mRNA: mRNA expression data in M2
- M1M2_mRNA: mRNA expression data in M1M2
- logFC(M1M2/M2): Fold Change (base 2) from M2 to M1M2 (MEV treated M2)
Raw 1: Name of nodes
To obtain the new table from the following example, type a name of receptor
###############################################
# ------------------------------------------- #
#                                             #
# Receptor_Name = 'Name_of_Receptor_you_want' #
#                                             #
# --------------------------------------------#
###############################################
Receptor_Name = 'IL6R'
sorted = pd.DataFrame(receptor_specifics[Receptor_Name])
sorted
Outcome 2

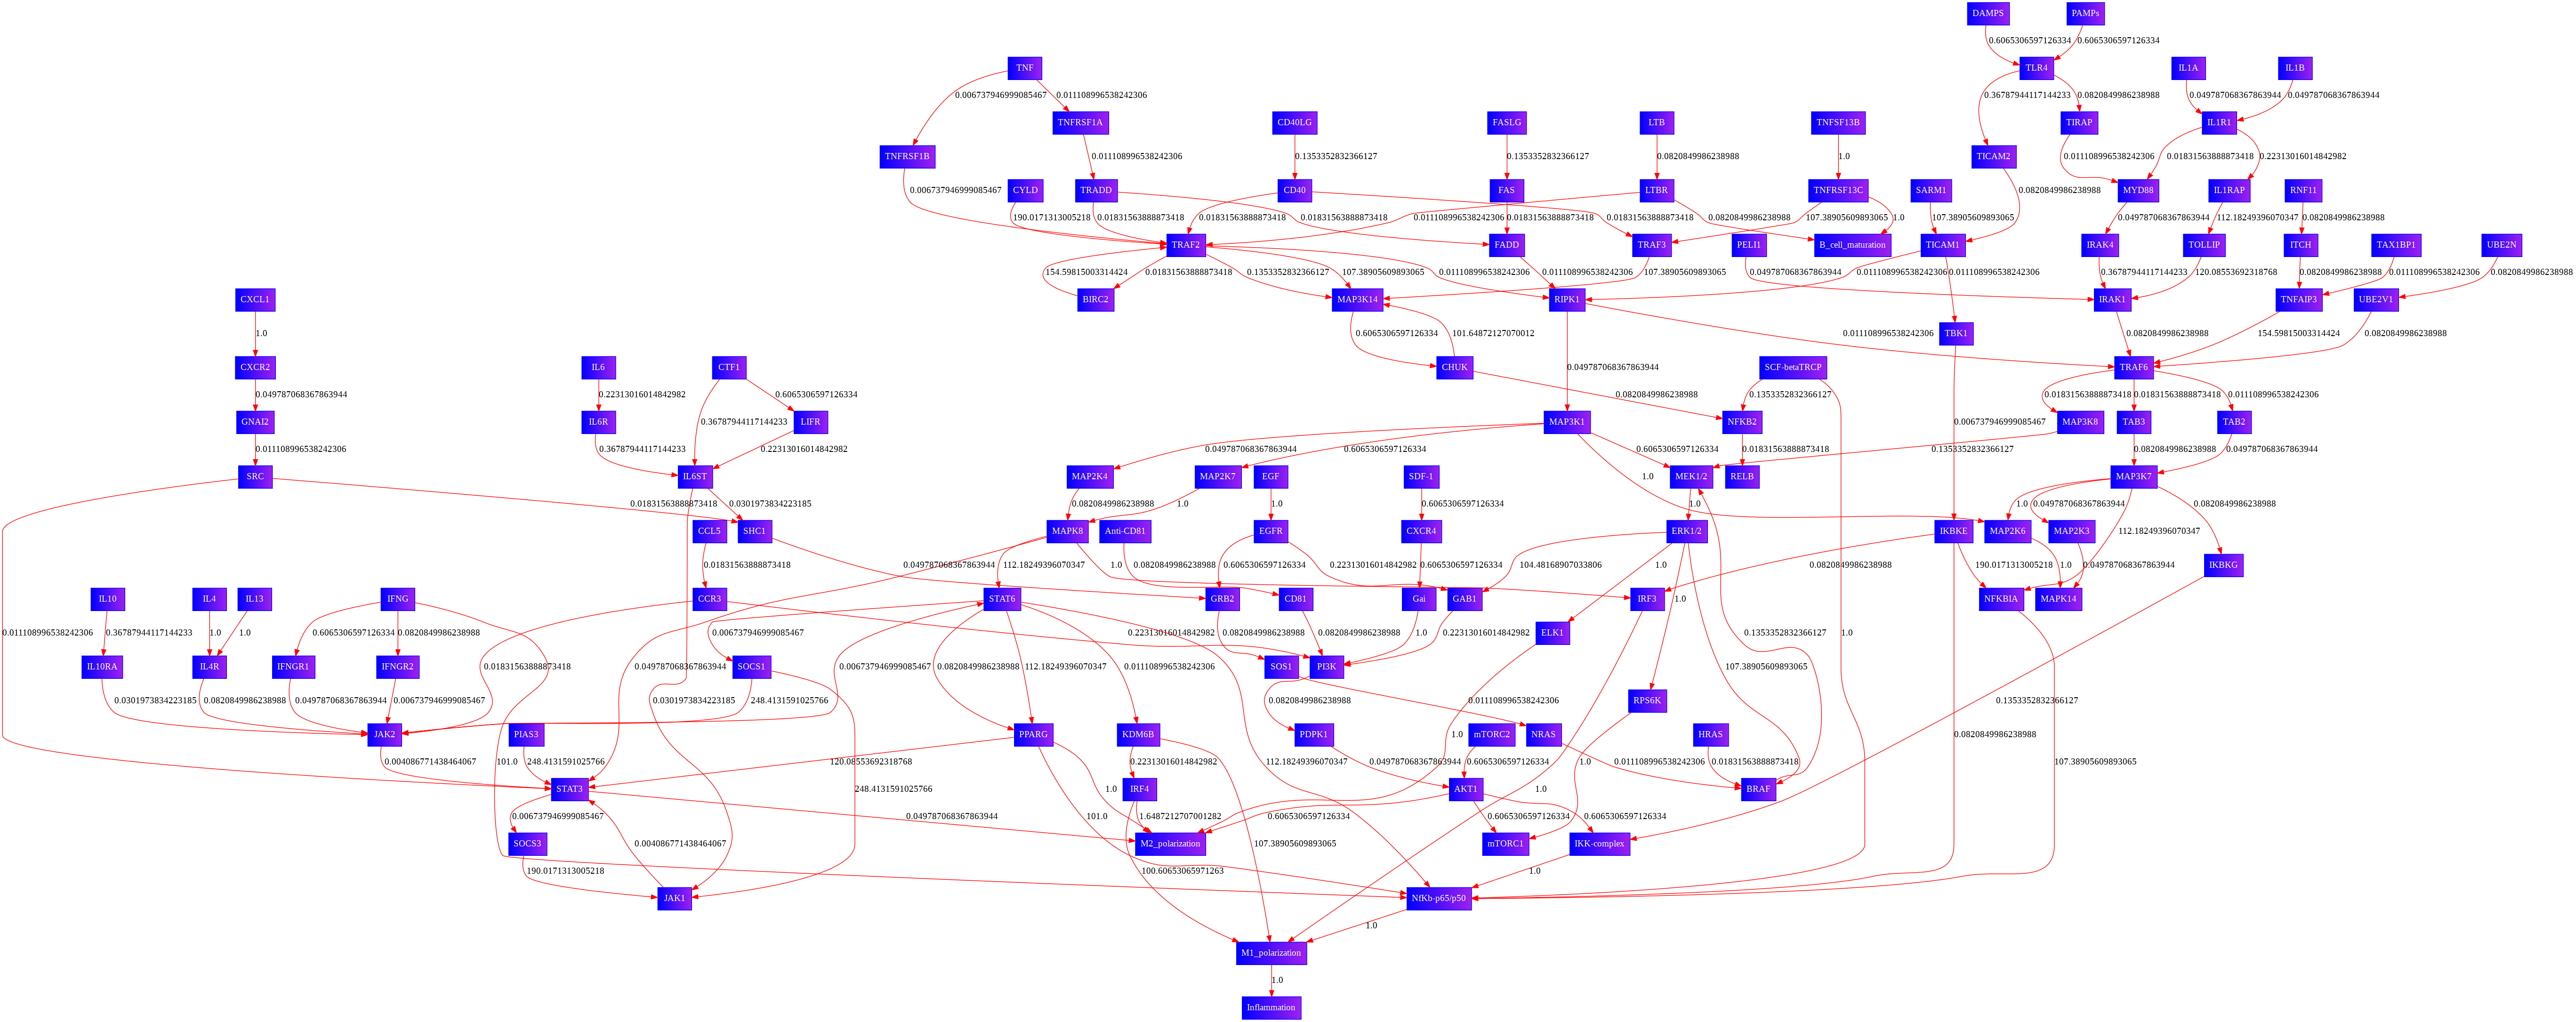
Locating Visulaized Network image
- In the directory of /content/pathwayanalysis (check out the first image posted at top), you should be able to locate new_figure_XXX.png

Outcome 3
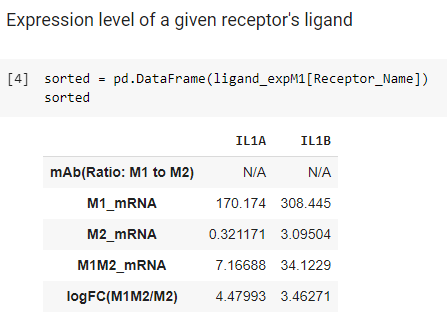
newsorted = pd.DataFrame(ligand_specifics[Receptor_Name])
newsorted

- This outcome provides a list of ligands associated with a selected receptor (Receptor_Name) along with their expression in mRNA and mAbs data.